
Last week I tweeted out an article from Popular Science.
http://www.popsci.com/hows-weather-over-there
The article talked about two new iOS apps, SatCam and WxSat. WxSat displays real-time satellite imagery, animated and hi-resolution. More than just visible imagery, WxSat provides infrared and water vapor imagery. Infrared imagery is essential for meteorologists because it can be used at night and gives the temperature of the cloud tops, an indication of how high in the atmosphere they are. Water vapor imagery shows the humidity of the air over different areas and is used for forecasting cloud cover, precipitation, and severe weather. Just like infrared, water vapor images are created using a different wavelengths in the electromagnetic spectrum than just visible light.
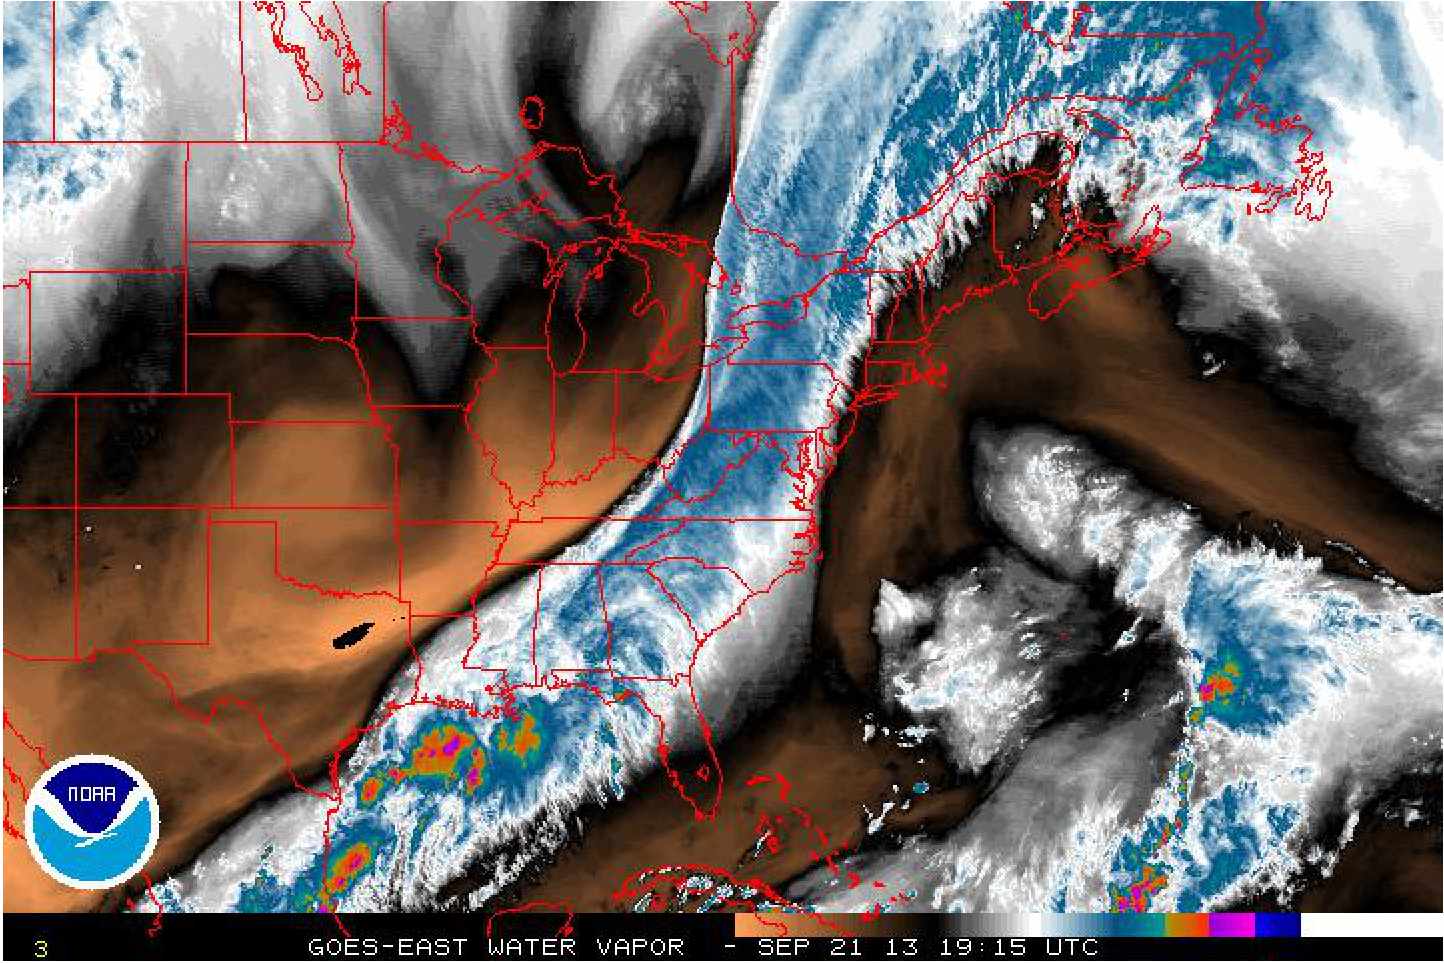
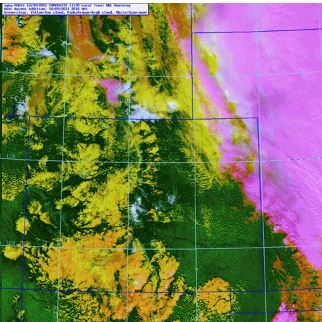
In the image above you can see a long cold front running from Canada to the Gulf of Mexico. The long, thin region of moisture is a dead giveaway. The orange region over the southern plains looks high pressure with cloudless skies.
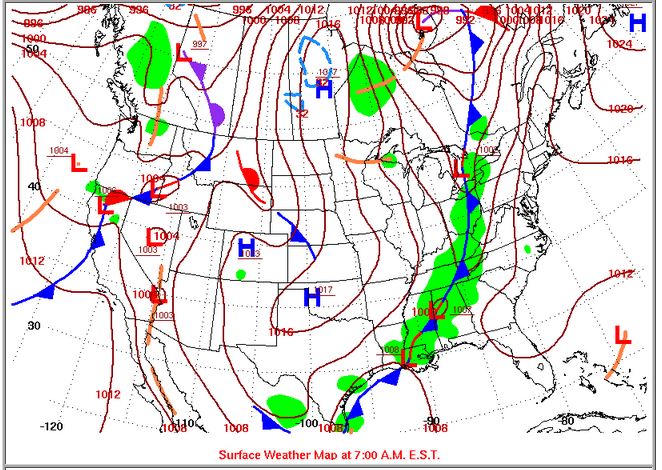
Now lets compare it to a surface map from that day.
So you can see the usefulness of such imagery. An app like WxSat is a great source of interesting data for an amateur meteorologist, so I suggest it to anyone who loves to look at imagery. However, of the two, its SatCam that’s of greater interest to me. This is because with it, you can help the National Oceanic and Atmospheric Association (NOAA) and University of Wisconsin-Madison’s Space Science and Engineering Center (SSEC). You do this buy taking pictures of the sky and ground while a satellite is overhead. From the article and app description:
“When you capture a SatCam observation and submit it to our server, it helps us to check the quality of the cloud products that we create from the satellite data.” In remote sensing, this is called “ground truth.” Ground-truth data allows researchers to calibrate remote-sensing data, and helps to interpret was has been recorded.
For your help you’ll get a satellite image taken over your area. But how are you helping? The answers lies in the term “cloud products”. This meaning how the satellite and its associated software identify where cloud cover is.
But wait, shouldn’t this be easy? Why are we still trying to identify where the clouds are in a satellite image?, they look white on visible imagery and show up as cold on infrared imagery. This is true, except snow is also white and cold.
For a human forecaster, there are several strategies that can be employed. You can look for shadows created by the clouds, identify rivers or cities standing out in the snow, or use your knowledge of the region’s topography to identify higher elevations. All of these are useful and show the continued need for the human forecaster, but these techniques are not helpful at night. Ultimately, are dependent on the cloud products used with satellite data to identify clouds from snow.
Whether its a human or computer analyzing the data, infrared wavelengths are a good start. Snow is cold, but high clouds are much colder. Temperatures at the level of high clouds can be around -50 or -60 degrees Celsius, a lot colder than that snow in your backyard (or most places on Earth ever get). So if a region in New Jersey has a temperature -50 C, its a near certainty that’s cloud and not snow. However, this strategy doesn’t work for clouds near the surface where cloud and snow temperatures are similar. What is used instead is a combination of wavelengths across the visible and infrared spectrum.
Using the slightly different ways clouds and snow reflect different wavelengths, atmospheric scientists can make better and better guesses at the cloud/snow question. It’s a great leap forward over naked-eye guessing, but its not perfect. It’s a technology that is constantly being improved, and that’s where your help is needed. You can use SatCam to photograph the ground and sky, thereby telling NOAA if snow or clouds are present and helping them improve their differentiation techniques.
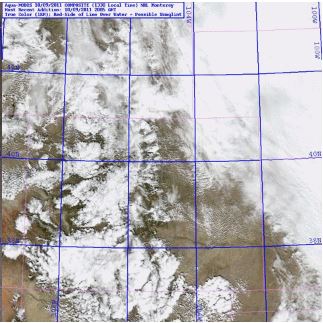
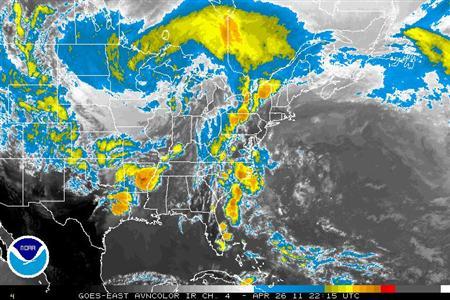
In 1999 and 2002, NASA launched the MODIS (Moderate-resolution Imaging Spectroradiometer) instrument on the two polar-orbiting satellites, Terra and Aqua. It has 36 separate wavelength bands that it uses for different purposes, on of which is cloud/snow identification. MODIS takes the data measured at different wavelengths and turns it into different colors. These “false colors“, designed for the human observer, indicate clouds and snow much like an infrared image indicates different temperatures. Using it, MODIS turned the image from earlier in this post into the one below, where we find out there wasn’t much snow in the image after all.
Again this image is from the RAMMB: GOES-R Proving Ground Blog at http://rammb.cira.colostate.edu/research/goes-r/proving_ground/blog/index.php/modis-snowcloud-discriminator/modis-snowcloud-discriminator-example/.
It’s a huge difference, and a great help to meteorologists. But there’s still a lot to improve upon, so I hope many of you will download the SatCam app. I love opportunities for the general public to get involved with real research and I’ll definitely stay on the lookout going forward. Both SatCam and WxSat are free to download. Thanks to all of you for reading and following Wildcard Weather, see you next time!
Check out the SatCam app’s website at http://satcam.ssec.wisc.edu/index.html. Here’s the website for WxSat http://www.ssec.wisc.edu/realearth/app/.
~Wildcard
Links:
Snow Detection in Weather Satellite Imagery
Cloud Detection over Snow and Ice Surfaces
RAMMB: GOES-R Proving Ground Blog
Snow, Fog, and Low Clouds in Central Europe
SSEC MODIS Try the false color!
