

Hello everyone!
In a previous post, I showed you how to read a skew-t diagram like a meteorologist. That post remains the most popular post on Wildcard Weather to this day and I’ve received a lot of kind feedback on it. Thank you all!
This post will be another look into the work of professional meteorology, namely forecasting using model output. Weather models are one of the most important tools in a forecaster’s tool kit, and they come in a variety of forms: some are regional with specialized purposes while others are global and predict a wide array of parameters. What they all have in common though is a need for initial conditions and a set of complex physical formulas to predict where those initial conditions will lead. The initial conditions for weather models come from radiosondes, or weather balloons, and you can read more about them in the Wildcard Weather post Weather balloons and their role in forecasting. How convenient!
While I will not discuss the intricacies of forecasting here, I will show you a few websites (mostly free) where you can find model output imagery and share a few thoughts about each site. If there are additional locations for model imagery you’d like to share, add a comment or tweet me!
Where to Find Real Weather Models
National Weather Service: Model Analyses and Guidance
https://mag.ncep.noaa.gov/model-guidance-model-area.php
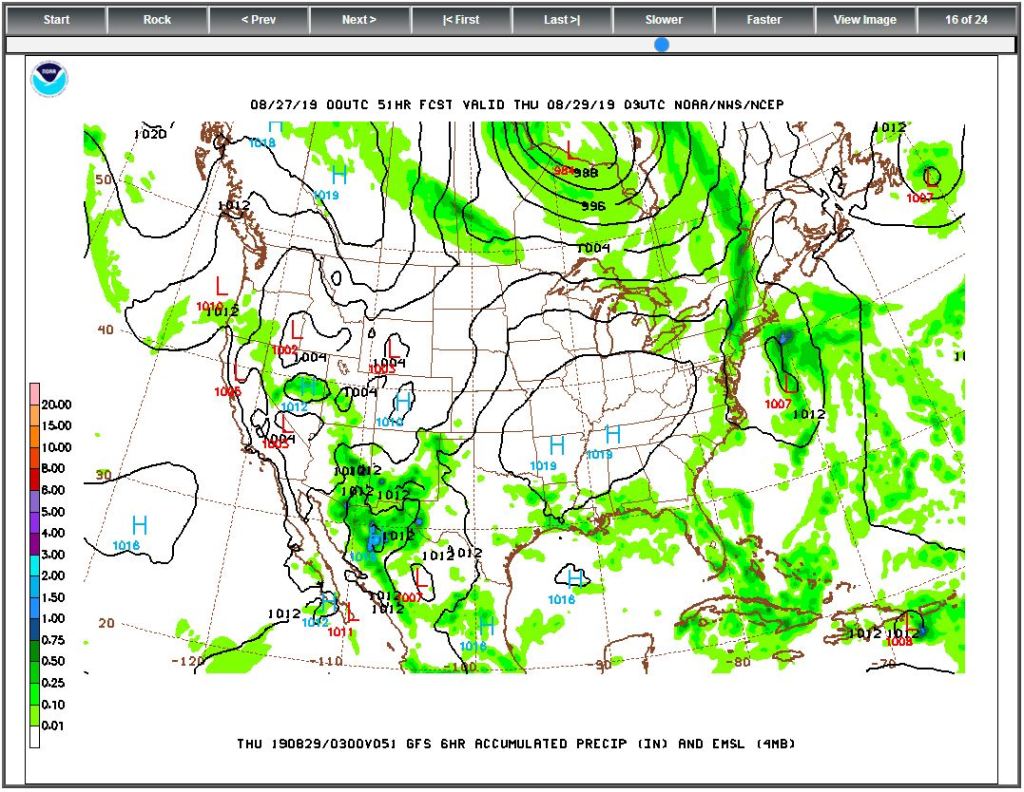
To me, there’s no more obvious place to start than the National Weather Service and their model guidance. The NWS Model Analyses and Guidance (MAG for short) website is available to the public and free to use. The site has a lot of output available, sorted by both model and area. Previous runs from the past 24 hours are available as well. The MAG site has plenty of models to look through, from the mid-range models you’re probably familiar with (GFS or NAM) to some short-range models you might not know (HRRR or SREF).

The model viewer, whether you choose a single time-step or a slideshow, is nothing fancy, but it is easy to navigate. The information you’re viewing will be displays both above and below the image, beginning with the date and time of the model run, followed by the time or time-step of the forecast data, and finally the forecast parameters you’re viewing. This simple and relatively clean viewer makes the NWS MAG website a good place for beginners to start.
College of DuPage NeXt Generation Weather Lab
https://weather.cod.edu/forecast/
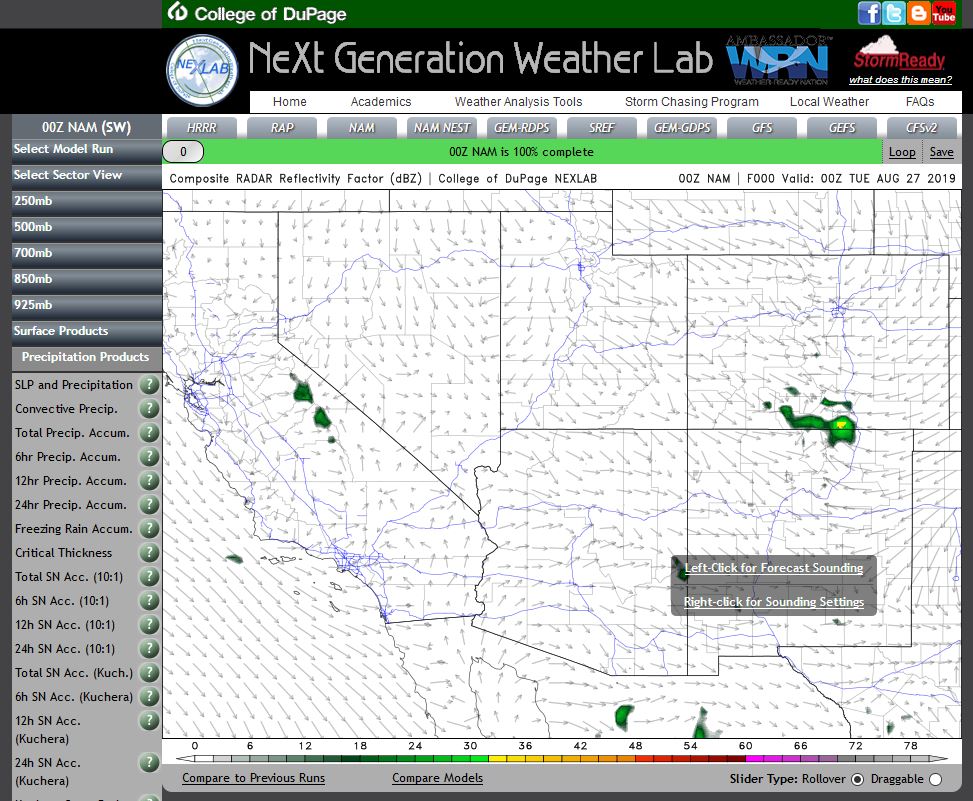
The next two locations I’ll discuss are run by college programs, but they are by no means amateur. The NeXt Generation Weather Lab, operated by the College of DuPage in Illinois, is one of the more impressive and comprehensive model viewers I’ve ever come across. It’s very popular with current and recent meteorology students and I can definitely see why. The NEXLAB has ten models available to view for up to 20 regions. The viewer is very comprehensive and past model runs are available for three whole days.
If you are an experienced forecaster wondering what the hotshot kids are using these days, NEXLAB is for you. But if you’re a weather model newbie, it may be too much. Data is densely packed in the tool and if you’re not familiar with all the terminology, it can be easy to lose yourself.
Penn State e-WALL
http://mp1.met.psu.edu/~fxg1/ewall.html
The e-WALL feels a little simple and archaic after the NEXLAB, but I’m still a fan. The reason is the e-WALL allows you to appreciate the complex daily cycle meteorologists live on, often thinking in UTC (Universal Time, otherwise known at Greenwich Mean Time) to keep track of when the next model runs will be posted. Models are grouped into run times (by UTC, use https://www.worldtimebuddy.com/ if you need a converter) and color-coded to display their status. Make sure the model run you choose is blue.
The e-WALL also makes it easy to jump immediately to a certain time-step, which allows for easy comparisons between models. It also helps new users understand when different model runs are updated and how old the forecast you’re looking at may be. The major downside for the e-WALL is that data itself is displayed in small, 4-panel images, even when you drill down to regional output. The e-WALL is an interesting introduction to weather models, but more experiences users will want to move on to one of the other options on this page.

WeatherBELL Premium: Not free, but one way to get the Euro Model
WeatherBELL is not free, and to be honest I’m not crazy about the viewer, but I do pay for it. The reason I do this is simple: the Euro. The ECMWF, or European model, is not available for free and you must pay to view the data through third-parties. And these days, if you’re a forecaster or serious enthusiast, you really need access to both the GFS and ECMWF model data. Forecasting is an important part of my job and I’d feel like I was going into each forecast shorthanded if I didn’t have ECMWF data.
WeatherBELL Premium costs $25/month or $250/year, making it quite pricey for the typical enthusiast. However, for a professional forecaster (ideally with access to a corporate purchasing account) it’s well worth it.

Have a thought or question about any of the tools listed here? Want to suggest another option? Put it in the comments!
~Wildcard
