
When a radiosonde, more commonly known as a weather balloon, is launched, it records a large amount of data. Temperature, dewpoint, and atmospheric pressure are all measured as it rises. It is an upper-air sounding, a way to gather meteorological observations beyond the reach of towers. The National Weather Service (NWS) launches weather balloons from each of it’s forecast offices twice a day, at 00 and 12 Universal Time (UTC). 00 and 12 UTC equals 7 AM and 7 PM EST. Think of UTC as the meteorologist’s Greenwich Mean Time (GMT).
For a full rundown of weather balloons and how they are used, visit an earlier post called Radiosondes (Weather Balloons) and Their Role in Forecasting.
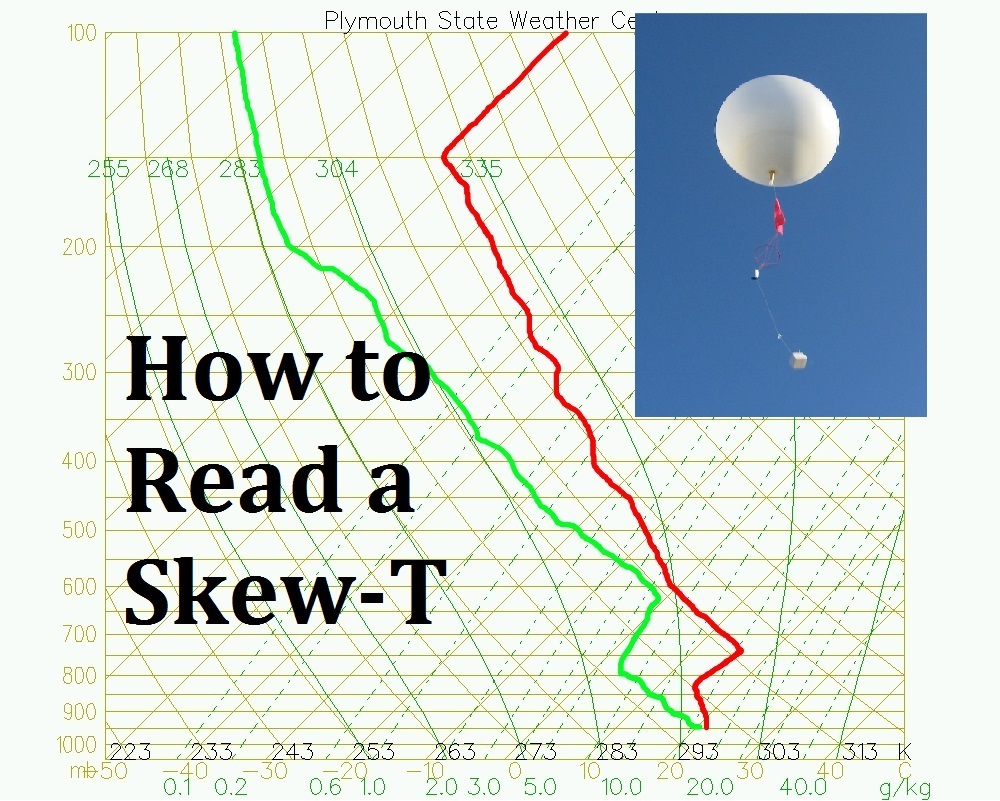
All of the data recorded by the radiosonde is put into a chart known as a Skew-T Log-P Diagram. Known mostly as just Skew-T, is a quick way for meteorologists to analyze and characterize the environment. What I’d like to do today is explain the Skew-T to you and a simplified way, using images. I will cover how to read it and then a how to use it, albeit in a simplified manner. I know some of this may be quite technical, but I feel this is a useful skill for the weather enthusiast or amateur meteorologist. I will mention that although Skew-T’s can come in a variety of designs and colors, all of the rules here will still stand. The rest will be in pictures, click on them to enlarge them. Good luck!
READING THE SKEW-T
Pressure:

Temperature:

Humidity:

Adiabats:


Radiosonde Data:


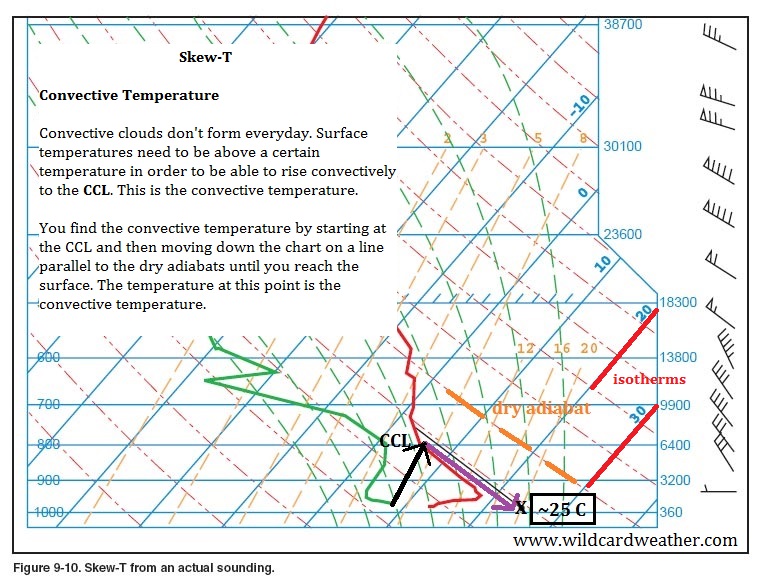
USING A SKEW-T
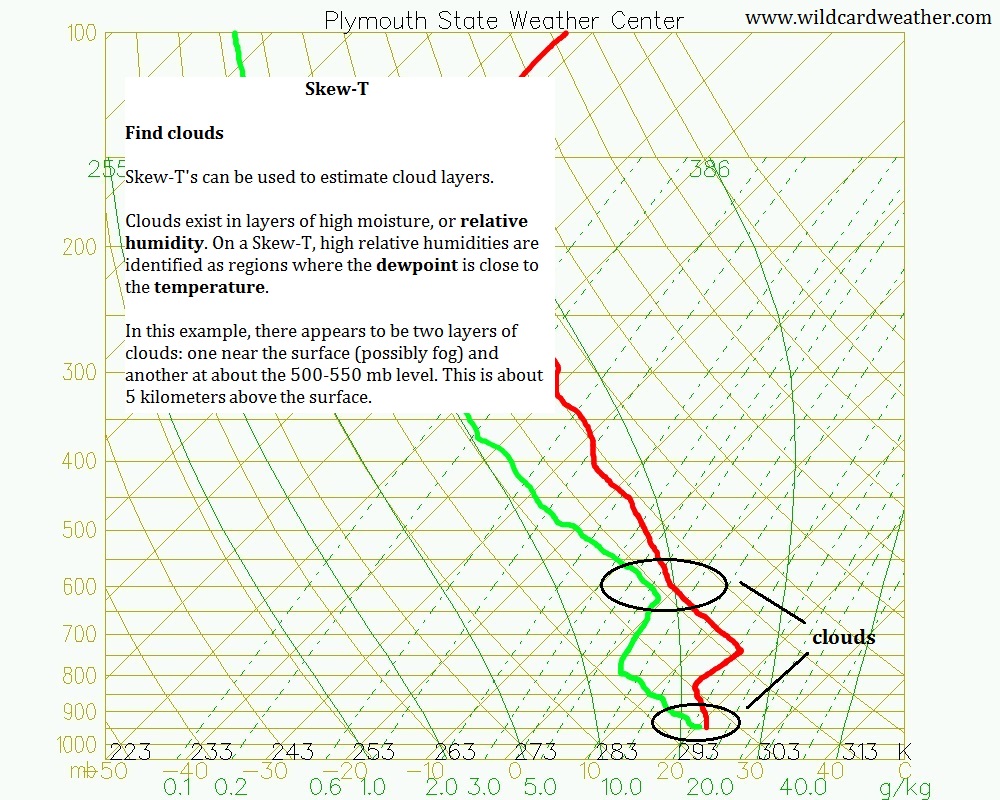
Clouds:
Inversions:

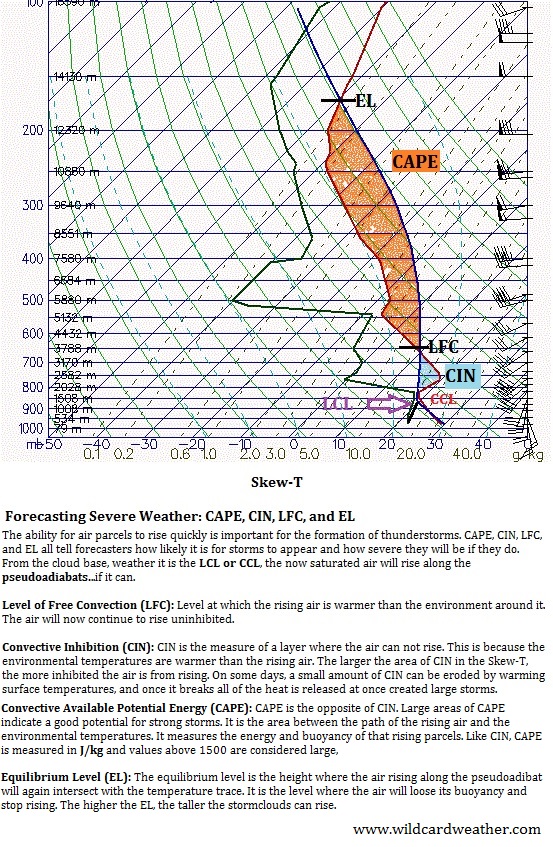
Severe Weather:


Want to find the most recent Skew-T for your region? visit http://weather.uwyo.edu/upperair/sounding.html
There’s a lot here, so e-mail me at wildcardweather@gmail.com if you have any questions. And as always, follow the blog on WordPress and on Twitter @wildcardweather
~Wildcard

Thank you for this great beginners article for total NOOBS to skew-t like me. I still have lots to learn but this is the best intro to skew-t I have found yet.
Thank you! I’m so happy to hear that.
This is so amazing. I am a Paraglider Pilot and have a course on Skew-T charts. This was like a Goldmine. Thanks
Please put a video tutorial too on Youtube if able.
Thank you so much. It’s the greatest joy to know this material is being used to teach others.
this is very helpful, thanks so much!
You are very welcome! Thanks for visiting.
i have watched and been reading tones on lessons on entry level skew-t stuff and have been nothing but more frustrated then when i started intill now, this has been the best and most broke down understandable lesson iv seen yet so thank you so much for this!!!!
You are most welcome and thank you so much for the kind words! It’s a pleasure to help.
I agree with the others – useful information presented in a very approachable manner. Thanks so much for your efforts!
Best, most succinct, most readable and enjoyable explanation yet !! Thanks so much for this web-page.
Thanks a lot, the content is very useful and you made it very easy to understand.
That was the best skew t education I’ve read!