Skip to content

wildcard weather

@wildcardweather / wildcardweather@gmail.com / Authored by Joe Fontana, professional meteorologist

  • Home
  • Learn more
  • About
  • Learn to Read a Skew-T Diagram
  • Find the Weather Models Meteorologists Use

Tag: dry adiabat

Learn to Read a Skew-T Diagram Like a Meteorologist! In Pictures.

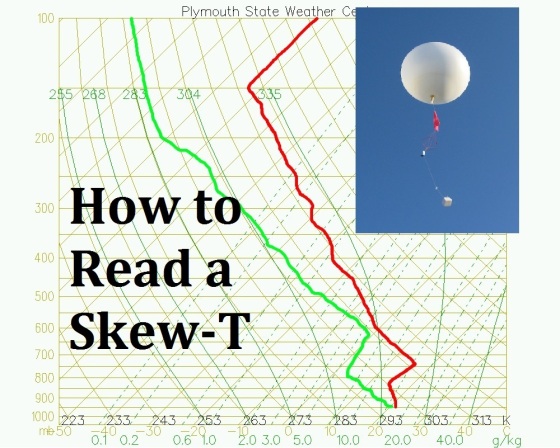
When a radiosonde, more commonly known as a weather balloon, is launched, it records a large amount of data. Temperature, … More

barametric pressure, CAPE, CCL, Celsius, CIN, cloud, condensation, constant equivalent potential temperature, Convective Available Potential Energy, convective condensation level, Convective Inhibition, convective temperature, dewpoint, dry adiabat, EL, Equilibrium Level, Fahrenheit, fog, forecaster, forecasting, GMT, Greenwich Mean Time, heat capacity, inversion, inversion layer, isentrope, isobar, isohume, isotherm, Kelvin, knot, LCL, Level of Free Convection, LFC, lifted condensation level, meteorologist, meteorology, millibar, National Weather Service, NWS, potential temperature, pressure, pseudoadiabats, radiosonde, relative humidity, saturated, saturation mixing ratio, severe weather, Skew-T, Skew-T Diagram, Skew-T Log-P Diagram, surface temperature, temperature, Universal Time, upper air sounding, US Standard Atmosphere, UTC, water vapor, weather, weather balloon, wind bard

Search Wildcard Weather

Top Posts

  • Learn to Read a Skew-T Diagram Like a Meteorologist! In Pictures.
  • Where to Find the Weather Models Meteorologists Use
  • Lenticular Clouds: The truth is out there

Enter your email address to follow this blog and receive notifications of new posts by email.

Join 261 other followers

Website Visitors

  • 127,553 and counting
Blog at WordPress.com.
Cancel

 
Loading Comments...
Comment
    ×
    Privacy & Cookies: This site uses cookies. By continuing to use this website, you agree to their use.
    To find out more, including how to control cookies, see here: Cookie Policy