
The Blizzard of 2015 may have been the blizzard that wasn’t for those in NYC, but it was still an impressive storm. Towns in my native Massachusetts received up to 35″ of snow, and the pictures made me jealous.
Okay, okay. Not that jealous. I admit I love storms; watching the models, watching the snow fall, the picturesque views when the sun comes out for the first time. But this is too much. Traffic has been a mess, the MBTA (Boston’s mass transit system) has been at a standstill, and there’s simply nowhere to put the snow. Just this once I will tolerate watching nor’easters from afar. BTW, everyone should follow Capital Weather Gang on Twitter, even if you don’t live near Washington D.C.
As we saw with this storm, forecasting nor’easters is quite hard.There is so much to consider. There is the track of the storm, where the rain/snow line will be (if anywhere), and where the most snow will fall. Those relatively small regions where the most snow falls are known as “jackpot regions”. The performance of computer models like the GFS and ECMWF with these storms is improving, but they do better with larger-scale features than the small ones. Human forecasters must also rely on experience and knowledge of the terrain to forecast snow totals.
Coastal Fronts
What I will describe tonight is the formation of coastal fronts inside nor’easters and how they effect snowfall totals. A coastal front is a stationary front, a line where cold air and warm air collide head-on.
Coastal fronts are more important for storms in the northeastern United States than in any other part of the country. This is because nor’easters, like any other storm here on Earth, are low pressure systems, and in the northern hemisphere low pressure systems spin counter-clockwise.

As the storm’s strongest winds blow onshore, it blows marine air over the land surface. The marine air is almost always warmer than the air over the land surface. This is because the specific heat capacity of the ocean water is larger than that of the land surface.Simply put, land surfaces heat and cool more quickly and thus are subjected to more extreme changes in temperature. When it comes to cold winter weather, ocean waters are more resilient and stay warmer throughout the wintertime.
As the warmer marine air is blown onshore, a boundary sets up separating the relatively warm from the undeniably cold. This is the coastal front, a type of stationary front.
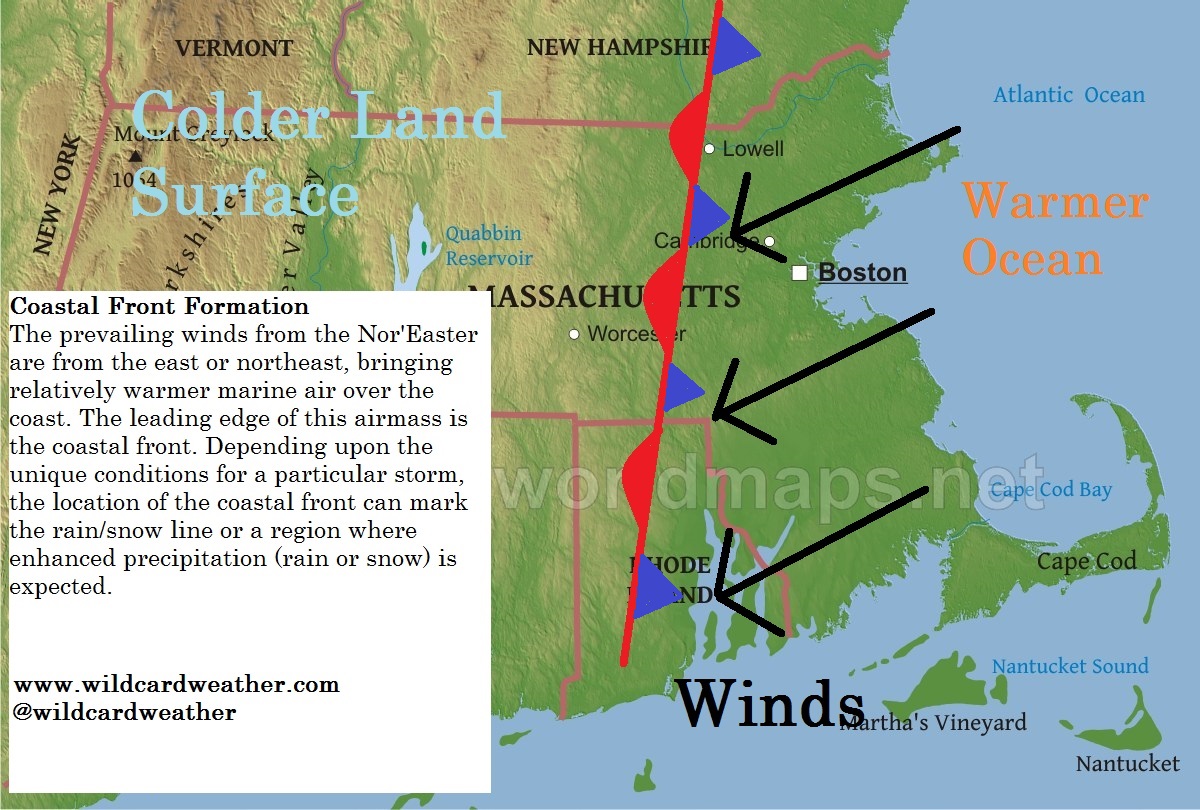
The orientation and location of the coastal front depends on a few things. They include wind direction, wind speed, and the temperatures of the ocean and on land. It’s easy to see how the rain/snow line could set up here. The area to the east of the front is warmer; if it is above freezing rain will fall on this side while snow will fall on the west. I will admit some of my own snow forecasts have been ruined because I forgot about the inflow of warmer, marine air.
Hitting the Jackpot
While the existence of this front can sometimes turn a snowstorm into a rainstorm, it can also produce a storm’s jackpot regions. This is because a stationary front is a region of rising air. From opposite directions the colder and warmer air masses collide at the surface. With nowhere else to go, the air rises. The area of rising air, inside a larger, low-pressure system of already rising air, adds extra energy to the storm. The faster the air rises, the more likely you are to see heavy accumulations of snow.

This is how the coastal front can create the jackpot region. Inside an already strong storm, it is a small region of enhanced precipitation caused by local topography. It doesn’t work this simply every time, but knowledge of coastal fronts can help you forecast an approaching storm or explain why a previous storm didn’t follow the model projections.
So did forecasters predict a coastal front for the Blizzard of 2015? Yes they did.
And here’s another Tweet from the storm showing the position of the coastal front through surface temperature observations.
In this particular storm we didn’t get a solid snowband because of the coastal front, but the temperature differences can change the characteristics of the snow. Temperatures closer to the freezing point produce dense, heavy snow while colder temperatures produce fluffy, light snow.
What did produce the heavy snow band is a larger feature, something called a deformation zone. It’s a little more complex and you can learn more from the The COMET Program at http://www.crh.noaa.gov/Image/lmk/pdf/deformation_zones.pdf
Here’s some more images that shows the strongest band during the blizzard and the storm’s final totals. Too be honest I wouldn’t be surprised if the band was strengthened by its position near the coast. It was certainly a powerful storm, but unfortunately Boston isn’t out of the woods yet. They’ve received two more snowfalls since last week and may receive another foot by this Tuesday! It’s truly unbelievable.

Hope you enjoyed this post! Follow the blog and follow of Twitter @wildcardweather
~Wildcard
